Personality Research Laboratory
Publications | Software | Methods | Links | Contact

On this webpage you will find a number of methods we have investigated over the years in our laboratory. We have published papers on some of these methods and others are available in the Idiogrid software. Our most recent work challenges mainstream approaches to psychometrics, research design, and statistical analysis. Most notably, with Observation Oriented Modeling, we have devised techniques for assessing psychological theories without making the untested assumption of continuous quantitative structure of attributes such as intelligence, traits, depression, anxiety, etc. Without this assumption most methods employed by psychologists (e.g., t-tests, ANOVA, Pearson's correlation, regression, IRT, SEM, factor analysis, multi-level modeling) are simply not legitimate. Our conclusion is thus that something of a drastic Gestalt shift is currently needed in psychology. Also in line with Paul Barrett's recent work with a graphical profiler, we have been exploring single-item self-report methods and finding them to be just as viable as multiple-item questionnaires in the domain of personality trait assessment. A body of evidence is growing that multiple-item questionnaires generate modest understanding, and that modern psychometric theory (embodied in Lord and Novick's classic text Statistical Theories of Mental Test Scores, 1968) has run its course and may have reached the limits of its utility.
Select a method from the list:
- Observation Oriented Modeling
- Idiogrid Software
- Dynamic Analog Scale
- Multivariate Analysis of Variance (MANOVA)
- Factor Scores / Scale Scores
- Generalized Procrustes Analysis
- Regarding the p-value in Null Hypothesis Significance Testing
- Cohen's Overlapping Distributions
Read a recent article that demonstrates OOM : Grice, J. W., Barrett, P. T., Schlimgen, L. A., & Abramson, C. I. (2012) Toward a Brighter Future for Psychology as an Observation Oriented Science, Behavioral Sciences, 2(1), 1-22.Overview
OOM Website : Reports most recent information regarding the book, free software, and publications.
Observation Oriented Modeling is a simple to use and easy to understand alternative to the variable-based models and statistical analyses that have stifled progress in psychology and the other social sciences for over 70 years.
Watch a 15 minute video introducing the logic behind OOM as well as the software.
Purchase the book published by Elsevier (Academic Press): Grice, J. W. (2011) Observation Oriented Modeling: Analysis of Cause in the Behavioral Sciences. New York, NY: Academic Press. (242 pages). The book can be purchased from Elsevier or from Amazon. Initial positive reviews of the book can also be found on both sites.
Use the FREE software. Most analyses currently employed by social scientists can be replaced by those in the OOM software. We have used the program in our univariate and multivariate courses at Oklahoma State University to analyze numerous existing data sets. Genuine data sets are also analyzed in the book and in a number of the instructional videos accompanying the software.
Consider more examples or presentations on the OOM website.
The following abstract from an invited address at the Southwestern Psychological Association's annual meeting provides a general description of this approach:
Recovering our Common Sense: Psychology as an Observation Oriented Science (Delivered at SWPA, Dallas, TX, April, 2010)
Since the early 1900s psychological research has been dominated by statistical methods that are overly abstract and often ill-suited for the types of questions most psychologists wish to ask. In this presentation Observation Oriented Modeling will be introduced as a radical alternative to these traditional methods of data analysis. Practically speaking, Observation Oriented Modeling challenges researchers to develop integrated models that explain patterns of observations rather than to estimate abstract population parameters. The focus of research is thus shifted away from aggregate statistics, such as means, variances, and correlations, and is instead directed toward assessing the accuracy of judgments based on the observations in hand. This shift brings the persons in a psychological study to the forefront of the analysis and conclusions, while completely eschewing such confusing concepts as Type I, Type II, Type III errors, statistical power, and the p-value. Philosophically, this new approach is more consistent with the common sense realism of Aristotle and Thomas Aquinas than with the idealism of René Descartes; and the end result is an approach to data conceptualization and analysis that is demanding and rigorous, but also straightforward and intuitive.
We have used Idiogrid for a good number of our studies. You can download a copy for free at the www.idiogrid.com website. Idiogrid is a contrived word composed of "Idio" from "idiographic" and "grid" from "repertory grid." Idiogrid is not simply a program for administering and scoring repertory grids. All sorts of self-report ratings can be gathered and analyzed with Idiogrid. Please visit the website to learn more about Idiogrid.
Dynamic Analog Scale (Single Item Assessment)
A growing number of studies are showing that single items can be used to assess personality traits or other conscious judgments that produce reliability and validity coefficients just as large in magnitude as multiple-item questionnaires. Working with single items is much more efficient and flexible than multiple-item questionnaires. Single items are also conceptually clearer and immune to various pitfalls associated with multiple items. Coupled with the issues of continuous quantitative structure discussed above, the efficacy of single items draws into question the hegemony of the traditional classical true score model.
We have published one paper demonstrating the Dynamic Analog Scale (DAS), a flexible method for generating single item assessments. We have a second paper under review, and the DAS was used in Jim Anderson's thesis, which we hope to submit for publication soon. The DAS can be accessed through the free Idiogrid program.
Grice, J., Mignogna, M., & Badzinski, S. (2011). The Dynamic Analog Scale: A generic method for single-item measurement. Personality and Individual Differences, 50, 481-485.
The published paper provides a list of references for single item assessments.
You can view a short video here that demos the DAS.
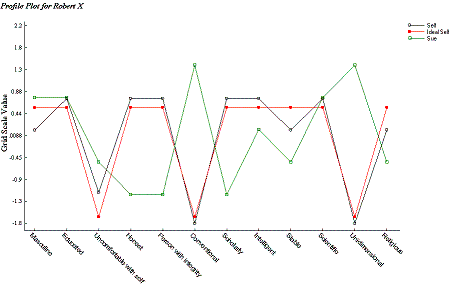
Paul Barrett's Graphical Profiler, which is more attractive than the DAS, is another excellent example of single item assessments that can prove highly effective. The Graphical Profiler also has a longer and richer history of development and validation than the DAS.
Multivariate Analysis of Variance (MANOVA)
MANOVA is the multivariate extension of univariate analysis of variance (ANOVA). It is a close relative of discriminant function analysis and profile analysis. The promise of such methods in personality psychology was to be the identification of types or of group differences in personality profiles. As a method based on aggregate statistics and the assumption of continuous quantities for the dependent variables, however, it appears this promise cannot be kept. Our (Grice and Iwasaki, 2001) work with MANOVA is a perfect example, as we utilized the most appropriate methods for conducting and interpreting the analysis based on Richard Harris' work; yet it is unclear how our results apply on an individual level to the persons in our study. We never attempted to demonstrate that personality traits are structured as continuous quantities as well; we simply assumed this was the case in the analysis. Future work should focus on methods that do not make this assumption and the host of other assumptions made when using a sampling based model in which population parameters are estimated. Observation Oriented Modeling is one possible way forward.
The material below must therefore be taken with several grains of salt unless the researcher is in the position of working with continuously structured quantitative attributes (e.g., body weight, head circumference, height, etc.).
Example individual profile on Personal Constructs:
Example group profiles on the Big Five:
We delivered a workshop on MANOVA at the 2005 meeting of the Southwestern Psychological Association in Memphis Tennessee. The workshop was published in the journal of Applied Multivariate Research as:
Grice, J. W., & Iwasaki, M. (2007). A truly multivariate approach to MANOVA. Applied Multivariate Research, 12, 199-226.
The SPSS files associated with this manuscript can be downloaded here:
SPSS data set from:
Iwasaki, M. (1998). Personality profiles of Asians in the U.S.: Cultural influences on the
NEO PI-R. Unpublished Masters Thesis, Southern Illinois University Edwardsville, IL.SPSS syntax for MANOVA analyses
SPSS syntax for computing a confidence interval for a simplified multivariate composite
Richard Harris' 'gcrcomp' program can be found on the software page.
Computing Factor Scores and Scale Scores from Multiple-Item Questionnaires
Imagine a male researcher who conducts an exploratory common factor analysis. The researcher examines the scree plot, extracts three factors and transforms them using varimax (orthogonal) rotation. He successfully interprets (labels) the factors and then decides to compute scale scores so he can correlate his factors with other variables for which he has collected data. In order to construct the scale scores, which are in fact simplified factor scores, he follows the advice of numerous texts on factor analysis by examining the structure coefficients (i.e., the bivariate correlations between the items and the factors). Scores for those items that meet or exceed his "salience criterion" of .30 in absolute value are simply added together to form his factor scores. Items with negative structure coefficients are first reflected before being entered into the summation calculations, and if the items are on different scales they are also converted to z-scores prior to being summed. The researcher's factor scores are thus simple sum scores computed from the original or standardized item scores.
Such sum scores pervade much of modern psychology. Simply consider your favorite scales and you will likely find they are comprised of simple sum scores that have been derived from the results of factor analyses or principal components analyses. Is this practice legitimate? In our current view, the answer is a decided "probably not." At the heart of any summation process is the legitimacy of assuming a quantitative structure or process. Sadly, psychologists -- including personality psychologists -- have failed to grapple with this issue sufficiently (see Barrett's "Shades of Milgram and Meehl"). We recommend the important work of Joel Michell for discussions of measurement in psychology; particularly, Michell, J. (1999). Measurement in psychology: Critical history of a methodological concept. Cambridge University Press. Also, in the long run, psychologists should employ correspondence analysis or some derivation thereof because it does not rely on the continuous quantitative assumption.
Even if the apparent difficulties regarding psychological measurement are ignored, we also consider the standard practice of summing salient items based on an examination of the structure or pattern (i.e., the regression weights for predicting the items from the factors) coefficients as flawed. The goal in creating the sum scores is to obtain rankings (or relative spacings) of the individuals in the analysis that reflect individual differences on the newly constructed factors. The rankings of the individuals should therefore be valid; that is, the rankings obtained from the simple sum scores should match the rankings on the factor composite itself. Unfortunately, when the simple summing process uses items selected on the basis of the structure or pattern coefficients, validity in this sense may be seriously compromised. For example, a person can be ranked as moderately extraverted on a factor labeled "extraversion/introversion" even though her true standing on the factor indicates she is an introvert. Can the procedure be fixed? Yes, if one switches attention to the factor score coefficients, which are regression weights for predicting the factors from the items. The factor score coefficients explicitly indicate how the items are weighted and summed to create the factor. Any process of computing factor scores should therefore be based on these coefficients, not the structure or pattern coefficients. Since only under certain circumstances will the relative magnitudes of the structure, pattern, and factor score coefficients be equivalent, all three matrices may yield different sets of salient items and therefore different sum scores. The sum scores based on the factor score coefficients will provide the most valid representations of the constructed factors.
A number of Monte Carlo studies conducted in our lab support the superior performance of the factor score coefficients in genuine data sets. A readable (we hope) paper on the topic resulting from this work was recently published:
Grice, J. W. (2001). Computing and evaluating factor scores. Psychological Methods, 6, 430-450.
We therefore recommend using the factor score coefficients whenever factor scores -- including simple sum scores -- are computed. Much more information can be found on a companion, and sadly dated, website devoted to factor scores:
http://psychology.okstate.edu/faculty/jgrice/factorscores/
We will not be updating the factor score website because we are moving away from using it in our research. It necessitates continuous quantitative attributes, which psychologists do not in practice measure, and it appears that single items can be used to obtain observations for personality traits/constructs that provide just as much predictive validity as factor analysis-based multiple item questionnaires.
Generalized Procrustes Analysis
From Grice, J. W., & Assad, K. K. (2009) Generalized procrustes analysis: A tool for exploring aggregates and persons. Applied Multivariate Research, 13, 93-112.
Imagine a female student who rates herself and nine other people whom she knows personally on 30 adjective trait terms (e.g., friendly, outgoing, agreeable) using a 5-point Likert-type scale. A personality psychologist subsequently records her responses in a 30 x 10 2-dimensional matrix:
The psychologist next recruits more people to participate in his study, obtaining 49 additional 30 x 10 matrices:
As shown the data can be represented in a 3-dimensional array comprised of trait terms, rated individuals, and participants. The goal of the study may be to identify common patterns in how the participants organize the 30 trait terms. How would the psychologist analyze this wealth of information; namely, 15,000 data points?
Now imagine a marketing researcher who asks a male participant to describe his favorite breakfast cereals using his own terms (e.g., crunchy, sweet, grows stale quickly). The researcher then constructs rating scales from the terms and asks the man to rate 10 popular breakfast cereals and the ‘ideal breakfast cereal’ on his personal scales. The researcher repeats this process with other participants, allowing each to use his or her own set of adjectives to describe the cereals. Moreover, the researcher does not require the participants to use the same number of adjectives; hence some participants provide three or four adjectives while others freely elicit twice as many terms to describe the cereals. Thirty-five people participate in the study, yielding data that may be represented as follows:
Unlike the personality psychologist, the market researcher is confronted with data that are matched on one dimension (cereals) but not matched on the other (the personal descriptors that differ across participants). Nonetheless, the goal of the researcher is to determine which breakfast cereals are alike and most similar to the ideal breakfast cereal. How is the researcher to reach this goal?
Gower’s (1975) approach to the type of data gathered by the personality and market researchers above involved an inventive combination of Procrustes rotation and Analysis of Variance (ANOVA), which he referred to as Generalized Procrustes Analysis.In this manuscript we demonstrate the usefulness of GPA for examining not only the aggregate structure of responses to personality data, but for examining the structure of individual responses as well. The full impact of GPA, and related methods of analyzing 3-dimensional data arrays, has yet to be felt in field of personality research. A completely worked GPA example, using Idiogrid, can be downloaded and examined.
Now, in our lab, the question surrounding the usefulness of GPA centers around the continuous quantity necessity of the attributes under investigation. GPA is based on an ANOVA decomposition of the data and it simply may not be legitimate for psychological attributes and the data we obtain to represent those attributes. A non-parametric form of GPA is needed.

Regarding the p-value in Null
Hypothesis Significance Testing (NHST)
We can only say what should now be obvious to any psychologist; namely, don't grow obsessive when it comes to the p-value. Strictly in the context of NHST with a statistical model in which the assumptions have been met it could be regarded as a useful statistic, but its associated common cut-points (.05 and .01) are nothing more than social conventions that should not be treated as rigid gatekeepers to the world of meaningful results. It should also now be well known that a small, highly significant p-value can almost always be bought with large sample sizes, but clinical/practical/theoretical significance cannot be so easily purchased. Of course the new battle on the horizon is the dismantling of effect size conventions; e.g., is d = .80 really a large effect size? It seems we have replaced one rote behavior and bad habit (".05 is a sacred cut-point that tells me my results are meaningful'') with a new one ("d = .20 = small effect; .50 = medium effect; .80 = large and really important effect"). Combating such rote behaviors is the goal behind Observation Oriented Modeling which attempts to shift the focus to interpreting patterns of observations rather than chasing abstract population parameters which almost never have an empirical basis in the NHST game. We agree with Paul Meehl that NHST is the top candidate as the worst thing to ever happen to psychology.
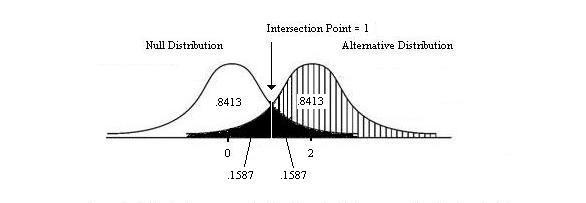
Cohen's Proportions for Overlapping Normal
Distributions
In his popular book, Statistical Power Analysis for the Behavioral Sciences (1988, 2nd Ed.), Jacob Cohen does not correctly compute the percentage of overlap between two normal distributions when showing the relationship between this percentage and d (the standardized mean difference effect size)...
Read more in this brief note (Adobe Acrobat, pdf, format) with Paul Barrett.